This article is a brief introduction to static analysis tools to hunt for client-side web vulnerabilities while giving some examples of ways I’ve successfully employed it so you can have fun with these tools too.
What’s this about static analysis anyway?
Static analysis is different from dynamic analysis (e.g., black-box testing with Burp). It never actually runs any code or depends on any running processes but instead parses raw source code. Think of the linter for your favorite programming language that complains about bad code patterns – that’s static analysis.
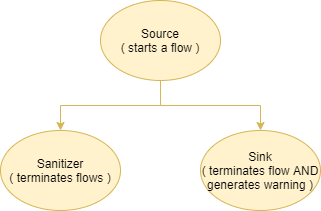
There’s a subset of static analysis called “data flow analysis” where a tool tries to determine how values propagate through a program. You define sources and sinks, and the static analysis pipeline then tries to determine if there are any data flow paths from any sources to any sinks.
Data flow analysis lets you do crazy things like define document.location.href (the URL in your browser) as a source and innerHTML as a sink and then the tool will report a warning if any viable paths exist for data to get from document.location.href to innerHTML.
Like magic, right? It basically means you can automagically determine if there’s any way for you as an attacker to control any data that ends up in an exploitable function.

In line with that, a few weeks ago, I thought: whenever you visit a web page you always have the source code of any relevant javascript, does that mean you can use static analysis (in particular data flow analysis) to discover DOM XSS vulnerabilities?
It turns out that yes, you can, and it works pretty well even if the scripts are minified. However, there are many ways static analysis can break or be made to work better, and I want to walk you through how to do this kind of analysis yourself and some caveats to watch out for.
The gist of the pipeline
The gist of how the analysis pipeline goes is something is like this:
- Obtain a snapshot of all the scripts on a page (i.e., download them)
- Run a static analysis pipeline on these files with some pre-written rules
And we’ll talk through them in that order because there are things to think about at both steps.
Obtaining the sources
When I started working on downloading all the javascript snippets on a page, I quickly realized that there were some problematic scenarios I had to plan around:
- Scripts may be behind authentication (i.e., need cookies or headers to access)
- Scripts can be loaded dynamically (e.g., through ajax + eval)
- Scripts are not guaranteed to be identical on different page-loads (e.g., generated with unique identifiers or based on browser headers)
- Many scripts are inline and don’t have a well-defined name (but we still have to download them)
- Scripts may be heavily minified and should be passed through some unpacker before you even consider looking at them
Realistically there’s not going to be any clean way to tackle all these points, and there’s always going to be some websites you can’t analyze properly, but oh well.
In the end I made a Chrome extension that dumps all loaded scripts onto my drive from the browser’s current context just to get around the authentication problem and used a prettifier on all files before analysis.
Still, to be frank, I’m not sure the extension was worth the effort because there are so few sites that bother with protecting their scripts with a login screen, and you could probably just dump all the scripts from Burp with an extension. I still recommend prettifying source codes though because most static analysis tools will report line numbers and minifiers tend to just inline everything.
Not much point to an “error on line 1” message if everything is on line 1, right? :P
To make life easy for everyone involved, I wrote a utility that grabs all the javascript snippets on a given page, dumps them into a folder underneath the utility, and optionally prettifies and deobfuscates them.
You can grab it here so you don’t have to write one yourself.
Once you have the files, the real fun begins.
Choosing and using a static analysis tool
There are a few static analysis tools out there that support data flow analysis, the two I ended up digging deeper into are:
CodeQL
CodeQL is super cool but also weird. It’s a mixture of Datalog (think SQL in steroids) and static analysis tool, and exposes a lot of low-level primitives to you, allowing you to do some super cool and detailed analyses.
The downside is that the development experience is genuinely terrible for custom rules and deploying them.
This is for three reasons:
- Poor documentation on the CodeQL language itself and the libraries they suggest that you should use
- The command line utility is very clunky and has no good way to present findings to the terminal
- You have to create a database for each codebase you want to analyze (quickly done but another step that can go wrong)
( I’m really selling this, aren’t I? )
As a result, it has a much steeper learning curve than the 2nd alternative that I’ll be focusing on in a little bit.
Even with that said, ultimately, I think CodeQL is the superior choice for dataflow analysis because once you successfully write your queries and set everything up, CodeQL gives you some absolutely crazy insights like the exact path data took through the program, and it does things like semantic equivalence (think X+Y being the same as Y+X) and many other things exceptionally well – it can even analyze minified JS code without making you want to jump off a cliff and does not have as many blindspots as some alternatives, which is quite an achievement.
I recommend checking out CodeQL eventually because it honestly more impressive and is now what I now use in my ‘production bug hunting environment’, but this article will be focusing on another tool mentioned below because it’s just… way way way simpler to explain how it works and will still let you find plenty of bugs.
Semgrep
I only recently stumbled upon this tool after it was mentioned to me by my friend dubs3c, but it has some clear advantages over CodeQL and some clear disadvantages:
Advantages:
- Easy to write rules for
- Hard to mess up
- Easy to integrate into other tools
- Does not depend on a database created for the codebase
- Supports more languages than CodeQL
Disadvantages:
- Much less granularity on defining sources, sinks and sanitizers, which leads to more false positives.
- Tool only outputs the dangerous sink rather than the entire path from source to sink – this can be an issue when dealing with complicated and nested codebases but is usually OK
- Relatively lightweight – will miss some dataflows because inter-procedural data tracking is partial
So if your goal is to set up a quick static analysis pipeline without worrying about a ton of crap I HUGELY recommend semgrep. It’ll get you enough mileage to find bugs and also give you an excellent path to learning more about static analysis.
Here’s an example of a Semgrep query that I used to find DOM XSS in a page in the wild:
rules:
  - id: domxss-insertAdjacentHTML
    languages:
      - javascript
      - typescript
    message: Found dangerous HTML output
    mode: taint
    pattern-sources:
      - pattern: document.location.href
      - pattern: document.location
      - pattern: window.location
      - pattern: window.location.href
    pattern-sinks:
      - pattern: $X.insertAdjacentHTML(...)
      - pattern: $X.innerHTML(...)
      - pattern: $X.innerHTML = ...
    severity: WARNING
Which basically just tells Semgrep to look for ways for data to end up in innerHTML or insertAdjacentHTML from any portion of your url. Saved as domxss-inneradjacenthtml.yaml you’d then run the semgrep utility like so:
semgrep -c domxss-insertadjacenthtml.yaml scripts/*
(Note the asterisk - I find that semgrep can have difficulty finding files sometimes so it’s better if you just specify them directly)
If it finds a dataflow path from one of the sources to one of the sinks it’ll spit out an error message highlighting the relevant sink, the source file it found the issue in and the appropriate line on the code.
You can also define sanitizers that will terminate any data flow path without generating a warning message so as to avoid false positives (e.g. you can set urlencode as a sanitizer so any data flow that goes through it is terminated since it’s likely not exploitable), though I didn’t bother in the above case since I just wanted to find all sinks which any data can reach.
You can play around with custom rules through the semgrep sandbox available on their website here, which is a pretty fast way to learn.
One big downside of Semgrep is that it won’t pick up wrapped functions. For example, it can pick up this:
function get_url() {
  return document.location.href;
}

function doStuff(){
  let temp = get_url();
  document.body.innerHTML = temp; <-- will trigger
}
But won’t pick this up:
function get_url() {
  return document.location.href;
}

function doStuff(){
  let temp = get_url();
   output(temp); <-- won't trigger
}

function output(param) {
  document.body.innerHTML = param; <-- will be missed
}
It does makes sense because marking output() as dangerous would be completely useless to anyone since it might have thousands of calls in the code, but in practice the above basically means that the more time you spend adding potentially dangerous functions ( like dangerouslySetInnerHTML ) as sinks the more things you’ll find because the static analysis pipeline won’t back-propagate the innerHTML call to mark e.g. the output function as problematic.
Putting it all together
The hard part is already done: we have a way to dump scripts and we have a static analysis pipeline with at least one rule. Next step is either adding more better rules or improving the dumping pipeline, though I recommend writing more rules because that’s ultimately what it comes down to – having patterns for bad bode.
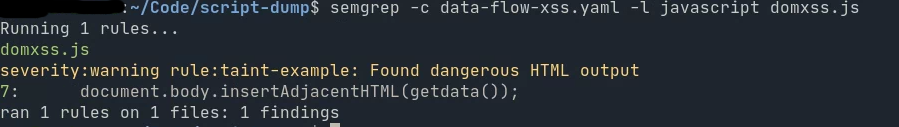
If you’re wondering if this actually works, it totally does. Here’s the output of semgrep on a (anonymized) real DOM XSS vulnerability I found on a storefront (and of course reported) by using semgrep + my dump-scripts utility.
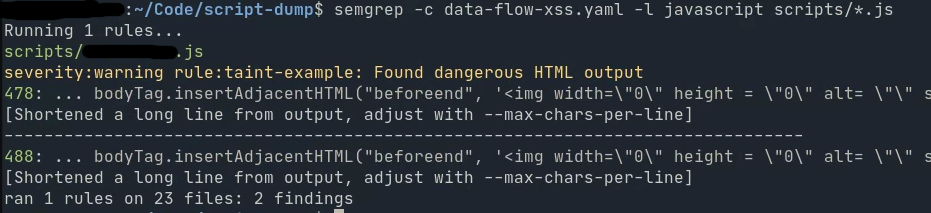
There are undoubtedly blindspots, and it’s undoubtedly not perfect, but it can find bugs and what more can you ask for? :)
That’s about all there is to it. I encourage you to think of ways you could automate this further – maybe run it automatically on newly discovered scripts or maybe pick up different bug classes like exploitable iframe postMessages, or maybe give CodeQL a try to pick up bugs more accurately.
Happy hunting!